Wildfire Imaging with EOIR
STK Premium (Air), STK Premium (Space), or STK Enterprise
You can obtain the necessary licenses for this training by contacting AGI Support at support@agi.com or 1-800-924-7244.
Pictures, graphs, and data snippets are used as examples only. The results of the tutorial may vary depending on the user settings and data enabled (online operations, terrain server, dynamic Earth data, etc.). It is acceptable to have different results. Users must have STK 12.5 in order to use the capabilities outlined in the lesson.
Capabilities covered
This lesson covers the following STK Capabilities:
- STK Pro
- Electro-Optical Infrared Sensor Performance (EOIR)
Problem statement
Detecting wildfires early is critical. It enables you to quickly respond with a containment strategy. The GOES-17 satellite has cameras that looks at both visible and infrared light. This makes the GOES-17 satellite a valuable tool for imaging the wildfires and seeing the differences between daytime images verses nighttime images. But how valuable is it? What can the satellite's cameras see? How can you get a better understanding of what you're seeing?
Solution
STK's EOIR capability models the detection, tracking, and imaging performance of Electro-Optical Infrared (EOIR) sensors for Earth science, space situational awareness, and missile defense applications. You can use the results of EOIR to support concept design, engineering, test, and operations. In this tutorial, you will model the GOES-17 satellite and model images from orbit with texture maps. You will also observe the results in the synthetic sensor data.
What you will learn
Upon completion of this tutorial, you will be able to:
- Model a visible and a infrared sensor
- Load in a reflectance and temperature maps
- Understand synthetic scenes.
Video Guidance
Watch the following video. Then follow the steps below, which incorporate the systems and missions you work on (sample inputs provided).
Necessary files
This lesson uses texture map files that you can downloaded from the STK Data Federate (SDF). Later in the lesson, you will learn how to make your own texture maps as well.
- Click here into a browser to go to STK Data Federate (SDF) to download the reflectance map (ReflectanceMap.csv).
- Download ReflectanceMap.csv.
- Click here to go to STK Data Federate (SDF) to download the temperature map (TemperatureMap.csv).
- Download TemperatureMap.csv.
Creating a new Scenario
You can create a new scenario. You will need to set the run time of half a day.
- Launch STK (
 ).
). - Click the button.
- Enter the following in the STK: New Scenario Wizard:
- Click to accept your settings.
- Click Save (
 ) when the scenario loads. A folder with the same name as your scenario is created for you.
 - Verify the scenario name and location shown in the Save As window.
- Click .
| Option | Value |
|---|---|
| Name: | EOIR_Wildfires |
| Start: | 20 Aug 2025 16:00:00.000 UTCG |
| Stop: | + 0.5 days |
Save (![]() ) often!
) often!
Verifying EOIR is installed
EOIR is a separate install. You can obtain the necessary install by visiting http://support.agi.com/downloads or calling AGI support.
- Extend the View menu if you do not see the EOIR toolbar (
 ).
). - Select the Toolbars option.
- Select EOIR.
Inserting the GOES-17 satellite
The GOES-17 satellite is one satellite in the Geostationary Observational Environment system, which monitors weather events. This particular satellite orbits over the western hemisphere. You will use it as the platform for your EOIR sensor.
- Select to insert a Satellite (
 ) object using the Orbit Wizard (
 )method.
 - Click .
- Set the Type to Geosynchronous.
- Rename the satellite GOES_17.
- Set the Subsatellite point to -137.2 deg.
- Click .
The GOES-17 satellite will stay in its assigned slot over time with station keeping. You inserted it in the scenario with the Orbit Wizard so you could set the specific orbital parameters. Had you inserted it from the Standard Object Database (SOD) then the TLE results would change over time due to consistent updates and station keeping.
Inserting a ground site
You will focus on the Big Basin Redwood State Park, which was unfortunately the site of a wildfire in 2020. This ground site will be used to point the direction of the sensor.
- Select to insert a Place (
 ) object using the Search by Address.
 - Click .
- Search for the place object by entering "Big Basin" into it's search criteria.
- Select the site with the Latitude: 37.17250 deg and a Longitude: -122.223 deg.
- Click .
Inserting a Sensor object
Let's add a sensor and place it on the GOES-17 satellite.
- Select to insert a Sensor (
 ) object using the Define Properties (
 ) method.
 - Click .
- Attach a sensor to the GOES_17 satellite.
- Select GOES_17.
- Click .
Define the sensor properties
By default, a sensor is mounted on a satellite pointed along a fixed direction. Using the targeted option, you can center the sensor's focus on the Big Basin State Park. That changes the angle of the sensor.
- Browse to the Basic - Pointing page.
- Set the Pointing Type to Targeted.
- Move (
 ) Big_Basin_Redwoods_State_Park_CA to the Assigned Target list. This is the point of focus for the sensor.
Setting the EOIR settings
You defined the point behavior of the sensor. Next, you can address the Electro-Optical Infrared component of this mission.
EOIR settings - Spatial
Set the EOIR spatial parameters for the sensor.
- Select the Basic - Definition page.
- Set the Sensor Type to EOIR.
- Ensure the Spatial tab is selected and set the following options. Leave all others as the default:
- Set the Processing Level to Radiometric Input.
- Click .
| Option | Value |
|---|---|
| Input | Field-of-View and Number of Pixels |
| Field of View - Horizontal Half Angle | 0.05 deg |
| Field of View - Vertical Half Angle | 0.05 deg |
EOIR settings - spectral
The GOES-17 satellite has 16 spectral bands which look at visible, NIR, and IR bands. You will begin this study looking at the visible components first. For simplicity, you will use the default settings and look at the visible waveband (0.4-0.7 um).
- Locate the Spectral Band Edge Wavelengths field. Review the settings.
- Low is set to 0.400 um.
- High is set to 0.700 um.
EOIR settings - optical & radiometric
You will be using many of the default settings to highlight how to get an image quickly. Take the moment now to review the optical and radiometric tabs, but do not make any changes.
- Select the Optical tab.
- Review the settings but leave the default values.
- Select the Radiometric tab.
- Review the settings but leave the default values.
- Click .
- Rename the sensor EOIR_Visible.
Generating a synthetic scene
Now that your camera has been set up, let's review what the synthetic scene sees
- Select the EOIR_Visible () in the Object Browser.
- In the EOIR toolbar, click the EOIR Synthetic Scene (
 ) button to generate an image that represents the sensor output.

Generating a synthetic scene with greater detail
Not a particularly meaningful image. Let's dial up the fidelity by setting the scene details to Fine.
- Right-click on the synthetic scene and select Details...
- Set the Scene Detail to Fine. This shows a higher resolution of the Globe.
- Click .
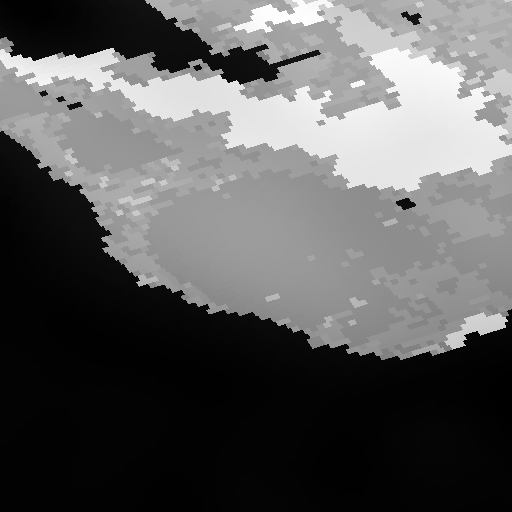
The mission thus far uses the built in globe imagery. Let's dial up the fidelity even further by creating and loading in custom reflectance and temperature maps.
Texture maps in the SDF
In this lesson, you use two types of texture maps: reflectance maps and temperature maps. Although you will learn how to create your own maps, this lesson provides you with example files on the STK Data Federate (SDF), which is a repository of files for STK lessons like the one you're doing now. The texture maps on the SDF have already been converted for you. They utilize the empirical line method to calculate and create data files. These example files are generated from Bing data, which only has red, green, blue data. You will use the data you have available and extend it to the wavebands used in this study.
Creating your own texture maps with MATLAB
For the purposes of providing background, here is how you can make your own texture maps.
These steps require access to MATLAB to complete. If you do not have MATLAB, you can skip this section and use the example reflectance and temperature map that you downloaded from the STK Data Federate (SDF) earlier in this lesson: ReflectanceMap.csv and TemperatureMap.csv.
- Use the snap frame to capture an image of the area of interest. Try to have the corner points of your area of interest approximately match these corner points:
- Make note of the latitude and longitude of your image's corner points.
- Save your image as test.jpg.
- Note your image's file path.
- Copy the code below into MATLAB:
- Replace
FilePath1with the location in your file directory where you saved test.jpg. - Replace
FilePath2with the location in your file directory where you want to save MyTextureMap.csv. - Run the MATLAB code to generate your texture map from test.jpg.
| Point | Latitude (deg) | Longitude (deg) |
|---|---|---|
| NW Corner | 37.69591 | -122.88801 |
| NE Corner | 37.69591 | -121.46507 |
| SW Corner | 36.67721 | -122.88801 |
| SE Corner | 36.66721 | -121.46507 |
a=imread('C:\FilePath1\test.jpg');
b=mean(a,3);
imagesc(b)
b=b/max(b(:));
csvwrite('C:\FilePath2\MyTextureMap.csv',b);
Temperature map
For the purposes of this lesson, you are provided with an example temperature map that was created by generating hot points (or "wildfires") on the texture map. This was done with a script that used a Gaussian blob generator and the sample MATLAB code to create the file. Although the fire generator script is not available to users, you can use the file generated by the script.
Import Reflectance Map
After downloading the example files, or creating your own. Follow the steps below to load them into the scenario for your visible camera to view. You'll first examine the reflectance map.
- Click the EOIR Target Configuration (
 ) button on the EOIR toolbar.
 - Click the button.
- Select the Texture Maps page.
- Insert a New Texture Map.
- Set the following:
- Rename the map to "Reflectance".
- Set the Type to Reflectance.
- Change the Value drop-down to File.
- Navigate to and load in the ReflectanceMap.csv file using the ellipses (
 ).
). - Set the corner points using the values from the table below.
- Click .
- Click to close the EOIR Configuration window.
| Point | Latitude (deg) | Longitude (deg) |
|---|---|---|
| NW Corner | 37.69591 | -122.88801 |
| SW Corner | 36.66721 | -122.88801 |
| NE Corner | 37.69591 | -121.46507 |
| SE Corner | 36.66721 | -121.46507 |
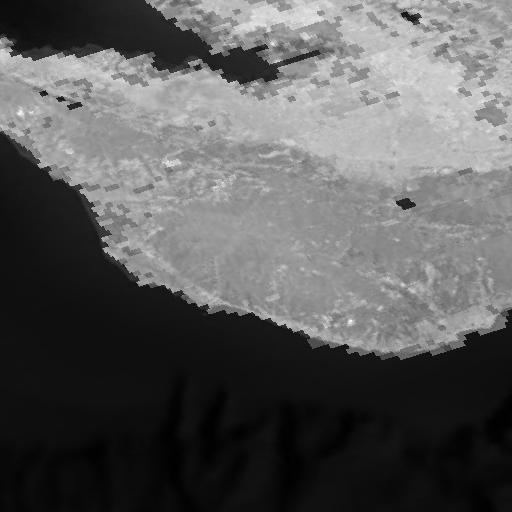
Revisit the EOIR Synthetic Scene
If closed, reopen the EOIR Synthetic scene. Otherwise if it was open, then the scene will automatically update. Examine the changes.
You can see a change in the synthetic scene, you now have more detail on of the mountains and the region as a whole. Let's continue developing yourmission and load in your temperature map next.
Import temperature map
You'll now examine the temperature map. After downloading the example files, or creating your own. Follow the steps below to load them into the scenario to configure your visible camera to view.
- Click the EOIR Target Configuration () button on the EOIR toolbar.
- Click the button.
- Select the Texture Maps page.
- Copy the Reflectance map.
- Paste the Reflectance map.
- Set the following:
- Name this map "Temperature".
- Set the Type to Temperature.
- Navigate to and load in the TemperatureMap.csv file using the ellipses ().
- Since you copied the early texture map, you already have the corner points entered in. You do not need to set them again.
- Click .
- Click to close the EOIR Configuration window.
Review the synthetic scene
Review the resulting synthetic scene then answer the questions below.

Why are there not any obvious changes in the display? You've loaded in a temperature map, however, you're looking at visible light! It's daytime and it's bright outside, so the fire is not easy to see. Let's look at long wave infrared light with your sensor.
EOIR Sensor
To simplify things, you will copy your existing sensor and make adjustments to the spectral characteristics. The GOES-17 camera does look at infrared light, you won't look at a specific band of the camera, but instead will broadly examine thermal infrared.
- Copy the EOIR_Visible () sensor in the object.
- Paste the sensor.
- Rename the sensor EOIR_LWIR.
- Open the EOIR_LWIR () sensor properties.
- In the Spectral tab, locate the Spectral Band Edge Wavelengths field.
- Set the following values:
- High is set to 12.000 um.
- Low is set to 8.000 um.
- Click .
Generate a synthetic scene
Now that your camera has been set up, let's review what the synthetic scene sees
- Select the EOIR_LWIR () in the Object Browser.
- Click the EOIR Synthetic Scene button in the EOIR toolbar to generate an image that represents the sensor output.
- Give STK a moment to generate the scene.
- Right-click on the synthetic scene and select Details...
- Set the Scene Detail to Fine. This shows a higher resolution of the Globe.
- Set the Color Map to BGRY.
- Click .
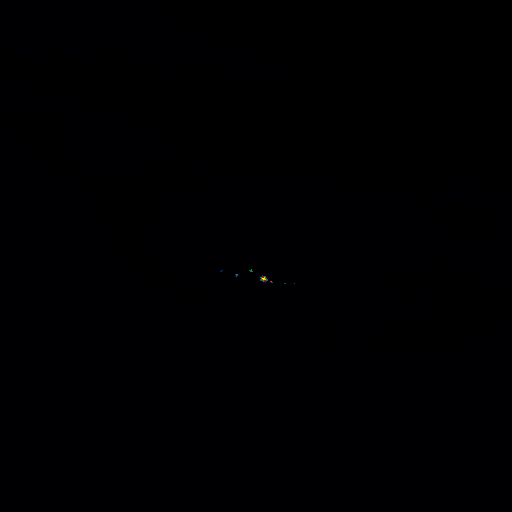
Review the synthetic scene
Review the resulting synthetic scene, answer the questions below:
- What changes do you see?
- Is there a way to view these wildfires with your visible camera?
In the image you see the hotspots of the wildfires. They're clearly visible for a few reasons. You're no longer seeing the bright daytime light because you're not looking at that part of the spectrum. The synthetic scene also has automatic gain control and you didn't change the radiometric settings. On your own explore changing the radiometric settings and seeing their impact.
You can see these wildfires with a LWIR camera, but is there any way you can utilize your earlier built camera that looked at visible light? Let's reexamine the region, but at night.
Adjust the scenario
Set the scenario to a time at night and load in reflectance and temperature maps taken at night.
- Set the scenario time to 21 Aug 2025 03:00:00.000.
- Save () the scenario.
Generate a synthetic scene
Now that your temperature texture map has been loaded in, let's review what the synthetic scene sees
- Select the EOIR_Visible () in the Object Browser.
- In the EOIR toolbar, click the EOIR Synthetic Scene button to generate an image that represents the sensor output.
- Give STK a moment to generate the scene.
- Right-click on the synthetic scene and select Details...
- Set the Color Map to Red 2.
- Click .
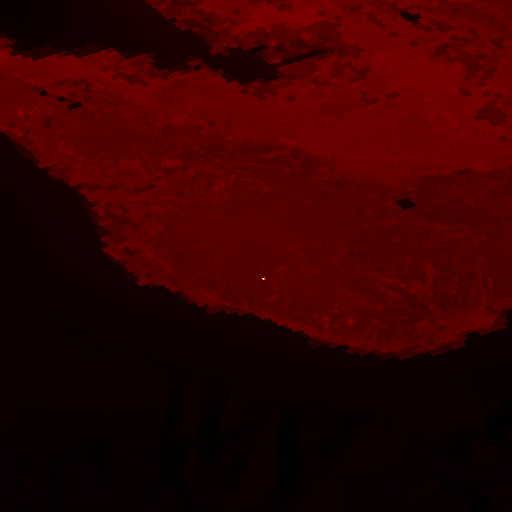
Review the synthetic scene
Review the resulting synthetic scene. What changes do you see?
You're now looking at the scenario at night. Without daylight the wildfire hotspot will light up in the scene!
Conclusion
Your goal in this mission was to understand what a satellite (GOES-17) would see when looking at wildfires. You modeled the satellite and the cameras on it. You also loaded in texture maps, specifically the reflectance and temperature maps, to model the region at a higher resolution and to see the wildfires. You found you can't see the hotspots with a visible camera during the day; however, you can see them with a LWIR camera. You can also see the wildfires when you look at the scenario at night.
Save your work
- Reset (
 ) the scenario when finished.
 - Close any reports, graphs, or tools that remain open.
- Save () your work.
On your own
In this lesson, you simplified the bands you looked at. The GOES-17 satellite looks at 16 bands. On your own, explore what each band would see and how the synthetic scene changes. Take the time to explore the radiometric settings and note how your scene changes with different sensitivities.